 What is spectral is visible to the eye
How can we visualize sounds? In the video we go over how our voice is produced and compare it to vocal production in songbirds. We introduce the spectrogram, a tool to be able to take look at these sounds, and define some common terms in bioacoustics. Then, we describe sound landscapes (or ‘soundscapes’), exploring the song of a few birds. Finally, we discuss how all of this is related to research carried out at the University of Buenos Aires.
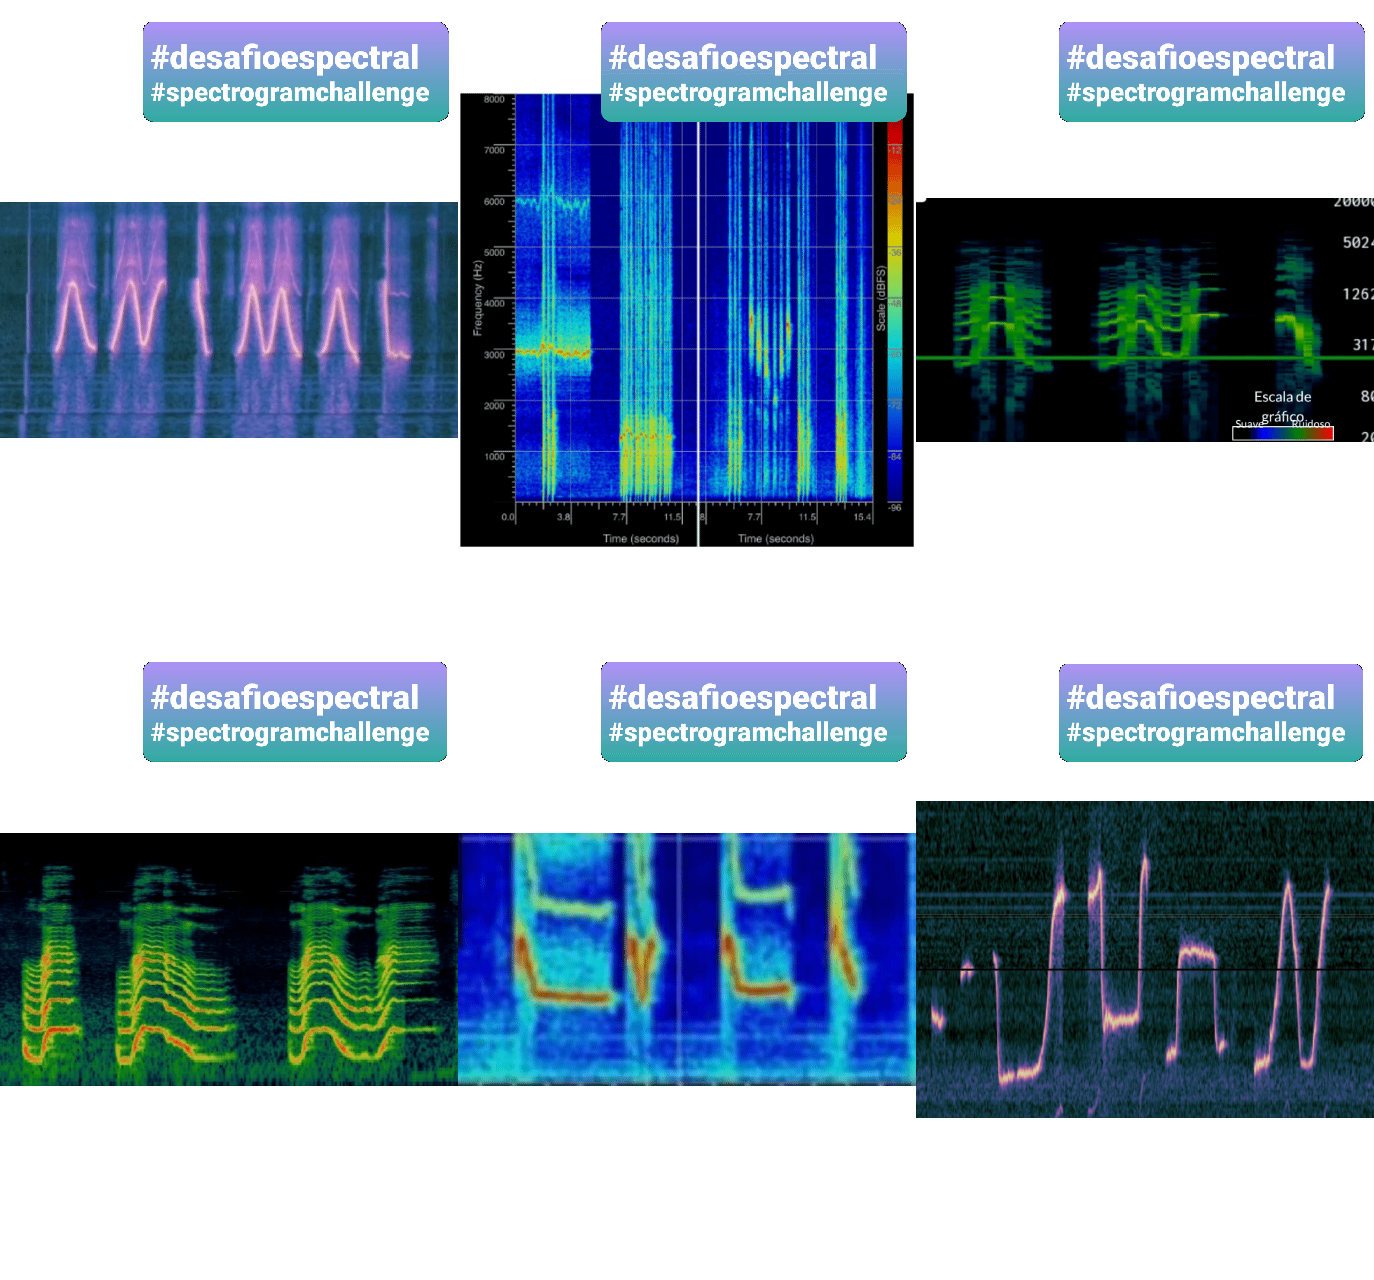
The spectral challenge is included in the video. What can you draw using sound? Check out a few submissions below!

You can make spectrograms online using this helpful web app from the Listening to Waves project, or you can download apps for your Android or iOS phone.
The video is in Spanish, so don’t forget to enable closed captions if you need them.